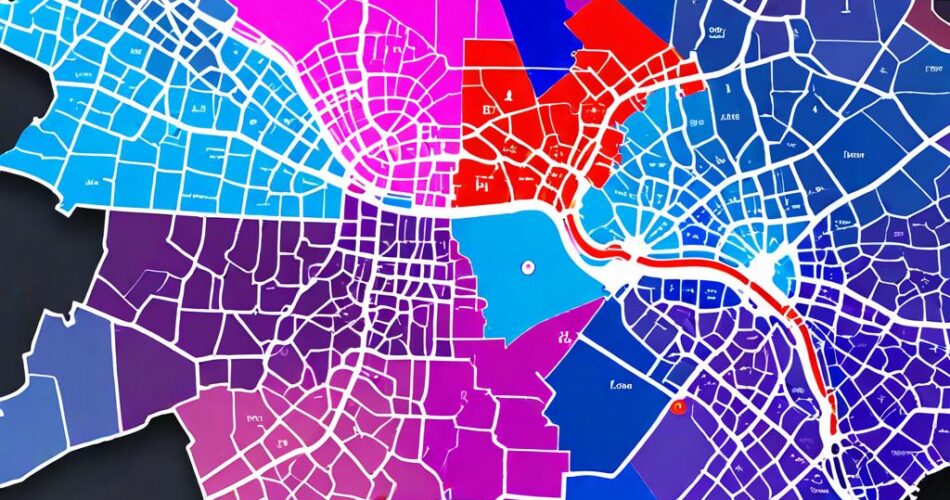
Navigating complex spaces, whether it’s a bustling office building, a sprawling museum, or a crowded conference center, can be a daunting task. Interactive floor maps offer a user-friendly solution, providing intuitive visual guidance and enhancing the overall experience. In this article, we’ll delve into the process of creating a basic interactive floor map using D3.js and TopoJSON, empowering you to build your own informative and engaging spatial representations.
D3.js: The Power of Data Visualization
D3.js (Data-Driven Documents) is a powerful JavaScript library that allows developers to manipulate documents based on data. Its flexibility and extensive capabilities make it ideal for creating dynamic visualizations, including interactive maps. D3.js excels at handling data binding, transformations, and transitions, enabling the creation of visually appealing and responsive representations.
TopoJSON: Simplifying Complex Geospatial Data
TopoJSON is a file format designed to efficiently represent geographical data. It provides a compact and optimized way to store geometries, reducing file sizes and improving loading times compared to traditional GeoJSON. TopoJSON uses a topology structure to represent shared boundaries between features, minimizing redundancy and enhancing performance.
Creating a Basic Interactive Floor Map
Let’s break down the steps involved in building a basic interactive floor map using D3.js and TopoJSON:
1. Data Preparation: Obtain the floor plan data in a suitable format, such as a vector image (SVG) or a GeoJSON file. If you’re working with an image, you can use a tool like Inkscape to convert it to SVG. For more complex spaces, you can use a GIS software to generate GeoJSON data.
2. TopoJSON Conversion: If your data is in GeoJSON format, you can convert it to TopoJSON using the `topojson` command-line tool. This will create a compact and efficient representation of your data.
3. D3.js Setup: Include the D3.js and TopoJSON libraries in your HTML file. You’ll also need to create a container element to hold your map visualization.
4. Loading and Parsing Data: Use D3’s `d3.json` function to load your TopoJSON file. Once loaded, use the `topojson.feature` function to extract the desired features from the topology.
5. Creating the Map: Use D3’s `svg` and `path` elements to create a basic map of your floor plan. You can use the `d3.geoPath` function to generate the path data for each feature based on the TopoJSON geometry.
6. Adding Interactivity: D3 offers various ways to add interactivity to your map. You can use event listeners to trigger actions when users click, hover, or interact with specific features. For example, you can display pop-up information about a room or highlight a specific area on mouseover.
7. Customization: D3 allows for extensive customization of your map. You can style the map using CSS, add labels, markers, or other visual elements to enhance clarity and information.
Example Code Snippet:
“`javascript
// Load the TopoJSON data
d3.json(“floorplan.json”).then(function(data) {
// Extract the floor plan feature
const floorplan = topojson.feature(data, data.objects.floorplan);
// Create the SVG container
const svg = d3.select(“body”)
.append(“svg”)
.attr(“width”, 800)
.attr(“height”, 600);
// Create the map path
const path = d3.geoPath();
// Draw the floor plan
svg.append(“path”)
.datum(floorplan)
.attr(“d”, path)
.style(“fill”, “#f0f0f0”)
.style(“stroke”, “#ccc”);
});
“`
Conclusion
By leveraging the power of D3.js and TopoJSON, you can create interactive floor maps that enhance navigation, provide valuable information, and improve the user experience. Whether you’re designing a museum exhibit, creating an office layout, or building a virtual tour, interactive floor maps offer a versatile and engaging way to visualize and interact with spatial data. The possibilities are endless, and with the right tools and knowledge, you can create compelling and informative maps that enhance your projects and captivate your audience.
