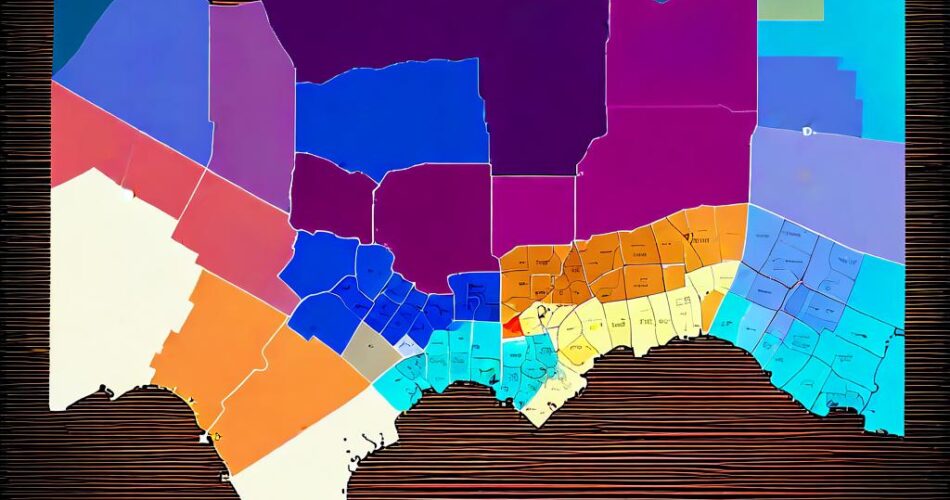
Creating interactive maps and visualizations is a powerful tool for presenting data in an engaging and accessible way. One common application is building floor plans, which can be used for various purposes such as wayfinding, facility management, or even showcasing real estate properties. This article will guide you through the process of creating a basic interactive floor map using D3.js and TopoJSON.
1. The Power of TopoJSON
TopoJSON is a compact format for encoding geographic data. It’s particularly useful for representing map geometries like polygons and lines, offering a more efficient way to store and transmit data compared to traditional GeoJSON. This efficiency is crucial when working with large and complex datasets, making TopoJSON a great choice for floor plan visualizations.
2. Setting the Stage with D3
D3.js (Data-Driven Documents) is a powerful JavaScript library for manipulating documents based on data. Its versatility allows you to create interactive visualizations, including maps, charts, and more. D3 provides functions for data binding, manipulation, and rendering, making it an ideal tool for building our interactive floor plan.
3. Preparing Your Data
Before we dive into the code, we need to prepare our data. The first step is to acquire your floor plan data. This can be obtained from various sources like architectural plans, CAD drawings, or even scanned images. The next step is to convert this data into TopoJSON format. There are various tools available online and offline for this conversion, such as QGIS, MapShaper, or even online converters.
4. The Code: Bringing the Floor Plan to Life
Let’s break down the code for creating a basic interactive floor map using D3 and TopoJSON:
“`javascript
// Load the TopoJSON data
d3.json(“floorplan.json”).then(function(data) {
// Extract the floorplan geometry
const floorplan = topojson.feature(data, data.objects.floorplan);
// Set up the SVG canvas
const svg = d3.select(“body”)
.append(“svg”)
.attr(“width”, 800)
.attr(“height”, 600);
// Create the floorplan path
svg.append(“path”)
.datum(floorplan)
.attr(“d”, d3.geoPath())
.attr(“fill”, “#f0f0f0”)
.attr(“stroke”, “#000”)
.attr(“stroke-width”, 1);
// Add interactive elements (example: room highlights)
svg.selectAll(“.room”)
.data(floorplan.features)
.enter()
.append(“path”)
.attr(“class”, “room”)
.attr(“d”, d3.geoPath())
.attr(“fill”, “transparent”)
.attr(“stroke”, “#000”)
.attr(“stroke-width”, 1)
.on(“mouseover”, function(d) {
// Highlight the room on mouseover
d3.select(this)
.attr(“fill”, “#ddd”);
})
.on(“mouseout”, function(d) {
// Reset the room fill on mouseout
d3.select(this)
.attr(“fill”, “transparent”);
});
});
“`
This code snippet demonstrates the core steps:
– Loading TopoJSON Data: We load the floorplan data using `d3.json()` and extract the geometry using `topojson.feature()`.
– Creating the SVG Canvas: We create an SVG canvas to hold our floor plan.
– Drawing the Floor Plan: We use `d3.geoPath()` to render the floorplan geometry as a path element.
– Adding Interactivity: We add event listeners for mouseover and mouseout events to highlight rooms on hover.
5. Expanding Functionality
This basic example provides a foundation for building more complex interactive floor maps. You can extend its functionality by:
– Adding Markers: Use `d3.symbol()` to represent points of interest on the floor plan.
– Implementing Tooltips: Display information about rooms, markers, or other elements on hover using `d3.tooltip()`.
– Creating Zoom and Pan Functionality: Allow users to explore the floor plan in detail using `d3.zoom()`.
– Integrating Data: Visualize data associated with different areas of the floor plan, such as occupancy, temperature, or other relevant information.
6. Conclusion
D3 and TopoJSON offer a powerful combination for creating interactive and informative floor maps. With this basic guide, you can start building your own interactive floor plan visualizations and explore the endless possibilities of data visualization using these tools. From basic wayfinding to advanced data analysis, the applications are vast and can be tailored to meet specific needs. So, get started today and map your way to engaging and insightful visualizations.
