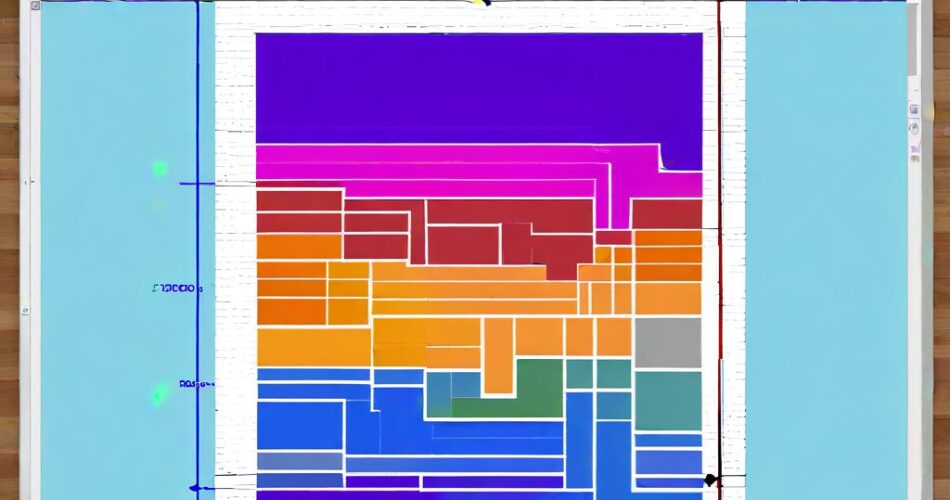
In the world of data visualization, interactive maps have become increasingly popular. They provide a dynamic and engaging way to explore spatial data, offering users the ability to zoom, pan, and interact with different elements. While creating interactive maps for global locations is a common task, the same principles can be applied to smaller, indoor spaces. This article will guide you through the process of building a basic interactive floor map using the powerful JavaScript libraries D3.js and TopoJSON.
Understanding the Tools:
* D3.js: A JavaScript library for manipulating documents based on data. It provides powerful tools for creating dynamic visualizations, including maps.
* TopoJSON: A format for encoding geographic data efficiently. It allows for representing complex geometries with minimal data, making it ideal for web-based maps.
Steps to Building the Interactive Floor Map:
1. Data Preparation:
– Floor Plan Design: Start with a digital floor plan of your space. This can be a scanned image, a vector graphic, or even a simple hand-drawn diagram.
– TopoJSON Conversion: The floor plan needs to be converted into TopoJSON format. Tools like QGIS or online converters like MapShaper can be used for this conversion. You’ll need to define the different areas or zones within the floor plan as separate features in your TopoJSON file.
2. Setting up the D3 Environment:
– Include D3.js: Include the D3.js library in your HTML file.
– Create a Canvas: Define a SVG element in your HTML as the container for your map. This will serve as the drawing surface for D3.js.
3. Loading and Parsing the Data:
– Load TopoJSON: Use D3.js’s `d3.json()` function to load the TopoJSON file.
– Parse the Data: Use `d3.geo.path()` to create a path generator, which will be used to draw the map features.
4. Drawing the Floor Plan:
– Map Projection: Choose a suitable map projection for your floor plan. For simple indoor maps, a basic projection like `d3.geo.mercator()` might suffice.
– Drawing Features: Use the `path()` generator to draw each feature from your TopoJSON data onto the SVG canvas.
– Styling: Apply CSS styles to customize the appearance of your map elements (e.g., fill color, stroke width, etc.).
5. Adding Interactivity:
– Zoom and Pan: Use D3.js’s `zoom()` behavior to enable zooming and panning of the map.
– Tooltip Display: Attach event listeners to your map features. When a user hovers over a specific zone, display a tooltip with relevant information (e.g., room name, capacity, etc.).
– Click Events: Implement click events to trigger actions like displaying more detailed information about a particular zone or navigating to another part of the floor plan.
Example Code Snippet:
“`javascript
// Load TopoJSON data
d3.json(“floorplan.json”, function(data) {
// Create a path generator
const path = d3.geoPath();
// Create SVG container
const svg = d3.select(“body”)
.append(“svg”)
.attr(“width”, 960)
.attr(“height”, 600);
// Draw the map features
svg.selectAll(“path”)
.data(data.objects.floorplan.geometries)
.enter()
.append(“path”)
.attr(“d”, path)
.style(“fill”, “lightgray”)
.style(“stroke”, “black”);
// Add zoom functionality
svg.call(d3.zoom()
.scaleExtent([1, 8])
.on(“zoom”, zoomed));
function zoomed() {
svg.selectAll(“path”)
.attr(“transform”, d3.event.transform);
}
});
“`
Conclusion:
By combining the power of D3.js and TopoJSON, you can easily create interactive floor maps that enhance the user experience. This approach provides a flexible and scalable solution for visualizing indoor spaces, allowing you to present information in a dynamic and engaging way. Whether you’re creating a map for a museum, an office building, or a retail store, D3 and TopoJSON offer the tools you need to bring your spatial data to life.
