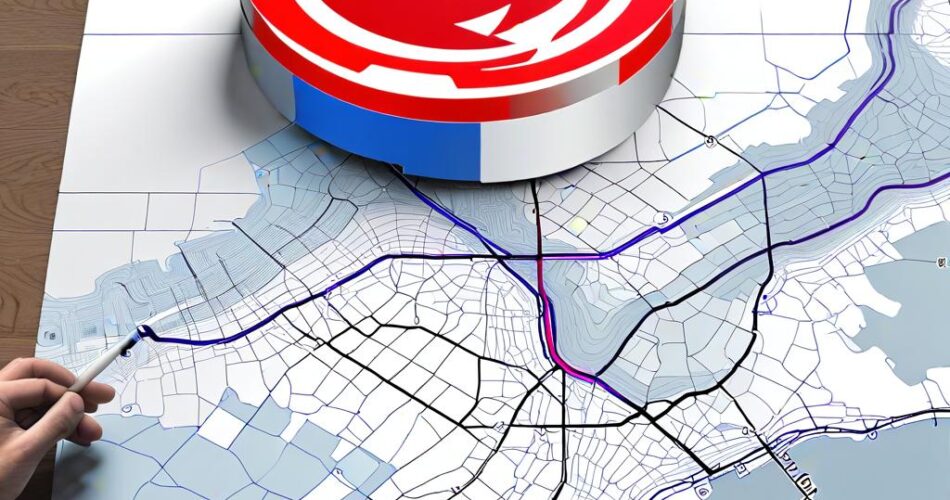
Imagine needing to navigate a large building, a sprawling campus, or even a complex museum. A traditional static map might be helpful, but an interactive floor map can revolutionize the experience, offering users a dynamic and intuitive way to explore their surroundings. This is where D3.js and TopoJSON come into play, providing powerful tools to build visually appealing and informative floor maps.
D3.js: The Power of Data Visualization
D3.js, short for Data-Driven Documents, is a JavaScript library that excels at creating interactive data visualizations. It allows developers to bind data to visual elements, creating dynamic charts, graphs, and maps. D3’s flexibility and control over the visual presentation make it an ideal choice for building custom interactive floor maps.
TopoJSON: Simplifying Complex Geometries
TopoJSON is a format that efficiently encodes geographical data, representing shapes and their relationships. It’s a powerful tool for storing and transmitting complex geometries, offering significant advantages over traditional GeoJSON. By using TopoJSON, we can create lightweight and efficient floor maps, reducing the data footprint and improving loading times.
Building the Interactive Floor Map
Let’s outline the steps involved in creating a basic interactive floor map using D3 and TopoJSON:
1. Data Acquisition: Obtain the floor plan data in a format compatible with TopoJSON. This can be achieved through various methods, including:
* Manual Digitization: Trace the floor plan in a vector graphics editor and export it as a TopoJSON file.
* CAD Conversion: Convert existing CAD drawings to TopoJSON using specialized software.
* Data Acquisition Services: Utilize services that provide pre-processed TopoJSON floor plans for specific locations.
2. Loading and Parsing: Load the TopoJSON file into the D3 environment using the `d3.json()` function. This parses the data and provides access to the floor plan’s geometries.
3. Creating the Map Canvas: Use D3’s `svg()` function to create an SVG canvas for the map. Define the dimensions and position of the canvas to fit the desired size and aspect ratio.
4. Rendering the Floor Plan: Utilize D3’s `path()` function to render the floor plan’s geometries from the TopoJSON data. You can customize the appearance of the floor plan by setting attributes like fill color, stroke color, and stroke width.
5. Adding Interactivity: Implement interactive features using D3’s event handling capabilities:
* Hover Effects: Highlight areas of interest when the user hovers the mouse over them.
* Click Events: Trigger actions like displaying information pop-ups or zooming into specific areas when the user clicks on a particular location.
* Panning and Zooming: Enable users to navigate the map by panning and zooming, allowing them to explore the floor plan in detail.
6. Adding Markers and Labels: Use D3’s `circle()` or `rect()` functions to add markers representing points of interest, such as entrances, restrooms, or elevators. Use D3’s `text()` function to add labels to these markers, providing context and information to the user.
Example Code Snippet:
“`javascript
// Load the TopoJSON data
d3.json(“floorplan.json”, function(data) {
// Create the SVG canvas
const svg = d3.select(“body”).append(“svg”)
.attr(“width”, 1000)
.attr(“height”, 600);
// Render the floor plan
svg.append(“path”)
.datum(topojson.feature(data, data.objects.floorplan))
.attr(“d”, d3.geoPath())
.attr(“fill”, “#f0f0f0”)
.attr(“stroke”, “#000”)
.attr(“stroke-width”, 1);
// Add a marker for the entrance
svg.append(“circle”)
.attr(“cx”, 100)
.attr(“cy”, 200)
.attr(“r”, 5)
.attr(“fill”, “red”);
// Add a label for the entrance
svg.append(“text”)
.attr(“x”, 105)
.attr(“y”, 200)
.text(“Entrance”);
});
“`
Conclusion
Using D3 and TopoJSON, you can easily create interactive floor maps that enhance user experiences. These maps offer a dynamic and engaging way to navigate complex spaces, providing valuable information and improving accessibility. By leveraging the power of data visualization, D3 and TopoJSON empower developers to build intuitive and informative floor maps that simplify the process of exploring and understanding physical environments.
