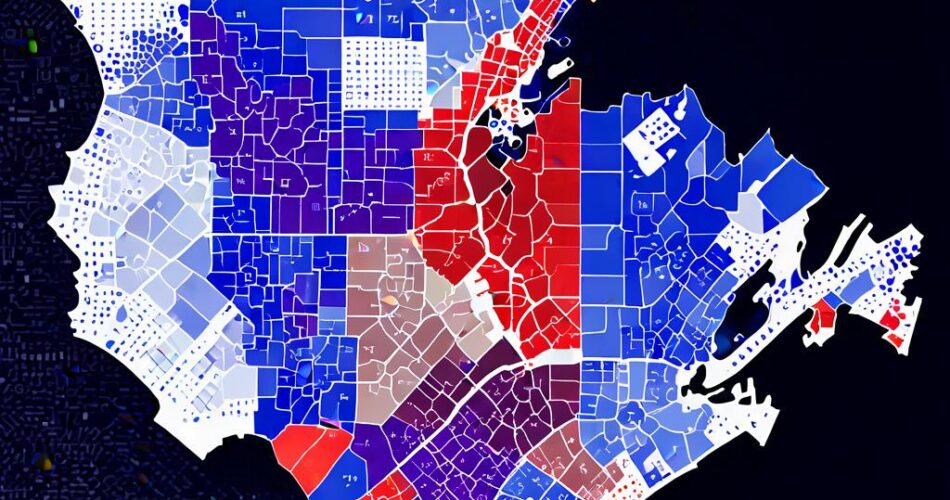
In the world of data visualization, creating interactive maps is an increasingly popular way to engage audiences and present information in a visually compelling and intuitive manner. While mapping the globe or a country is common, often the need arises to visualize a more localized space – a building, a floor plan, or even a specific room. This is where the power of D3.js and TopoJSON comes into play.
D3.js (Data-Driven Documents) is a powerful JavaScript library that allows developers to create interactive data visualizations. It provides a flexible framework for manipulating and rendering data using HTML, SVG, and CSS. TopoJSON is a format that efficiently encodes geographical data, including polygons representing regions or spaces. By combining these two tools, we can create highly interactive floor maps that showcase data in a visually appealing and informative way.
Getting Started: The Foundation of Your Interactive Floor Plan
The first step is to obtain the floor plan data. This can be achieved through various means:
* Scanning and Digitizing: Scan a physical floor plan and use software like Adobe Illustrator or Inkscape to trace the outlines of walls, doors, and other features. This process yields a vector-based representation that can be exported as an SVG file.
* CAD Software: If the floor plan is already in a digital format, you can export it as a DXF or DWG file.
* Online Mapping Tools: Services like Google Maps or OpenStreetMap can be used to generate map data, but they might not be ideal for detailed floor plans.
Once you have the floor plan data, you need to convert it into a TopoJSON file. This can be done using tools like `topojson` command-line utility or online converters. The TopoJSON file will contain the geographical information in a compact and efficient format, ready to be processed by D3.js.
Building the Interactive Canvas: Bringing Your Floor Plan to Life
Now that you have the TopoJSON file, you can start building the interactive floor plan using D3.js. The process typically involves:
1. Loading the Data: Use D3’s `d3.json` function to load the TopoJSON file and extract the geographical features.
2. Creating the Map Container: Define an SVG element in your HTML document, which will serve as the canvas for your interactive map.
3. Projecting the Data: Use D3’s projection functions, like `d3.geoMercator` or `d3.geoAlbersUsa`, to transform the geographical coordinates from your TopoJSON file into pixel coordinates suitable for displaying on the SVG canvas.
4. Rendering the Floor Plan: Use D3’s `path` generator to draw the polygons representing walls, rooms, and other features on the SVG canvas.
5. Adding Interactivity: D3.js provides various methods for adding interactivity to your floor plan, such as:
* Hover Effects: Highlight specific areas of the floor plan when the user hovers over them.
* Click Events: Trigger actions like displaying information about a room or opening a modal window when the user clicks on a particular area.
* Zoom and Pan: Allow users to explore the floor plan in detail by zooming and panning the map.
Beyond the Basics: Enhancing Functionality and Data Visualization
Once you have a basic interactive floor plan, you can further enhance its functionality and data visualization capabilities:
* Adding Markers: Use D3’s `circle` or `image` elements to represent specific points of interest on the floor plan, such as desks, fire extinguishers, or emergency exits.
* Data Binding: Bind data to specific areas of the floor plan, such as occupancy levels for rooms or equipment locations. This data can be displayed using tooltips, charts, or other visual elements.
* Adding Animations: Use D3’s animation capabilities to create dynamic transitions, such as fading in or out elements or smoothly animating zoom and pan interactions.
Conclusion: Mapping the Future of Interactive Floor Plans
Using D3.js and TopoJSON, you can create highly interactive and informative floor maps that go beyond static representations. By leveraging the power of data visualization, you can effectively communicate information about physical spaces, enhance user engagement, and create compelling experiences. Whether you’re designing a virtual tour of a museum, visualizing office layouts, or creating a dynamic map for an emergency response plan, the combination of D3.js and TopoJSON offers a powerful toolkit for mapping the future of interactive floor plans.
